
I asked ChatGPT to predict Bitcoin's price based on historical chart patterns, and the result is shocking!
Is ChatGPT smart enough to predict the future of Bitcoin? Lets read the result.
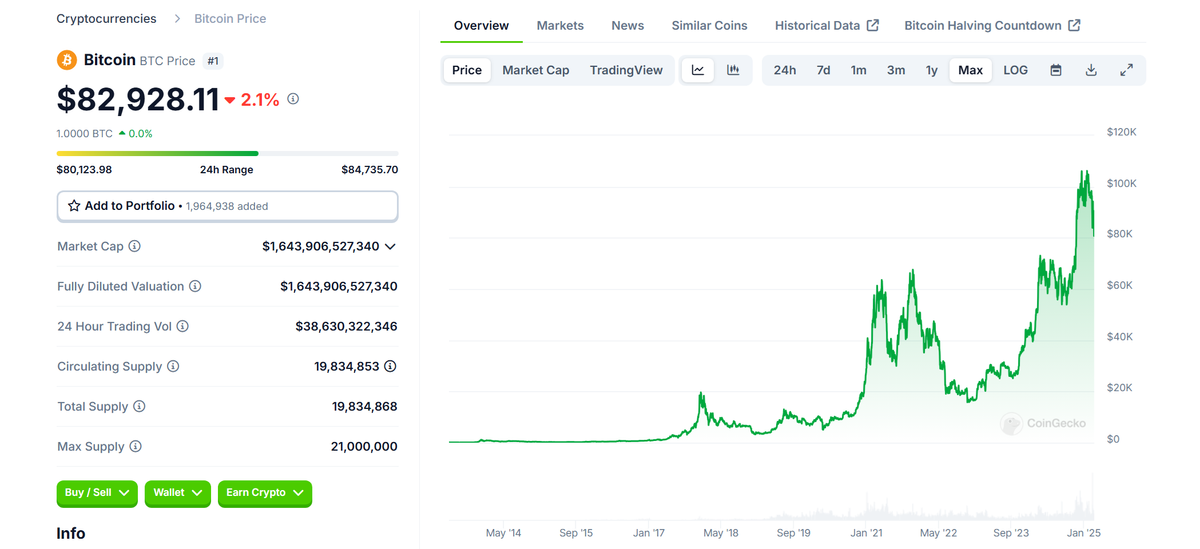
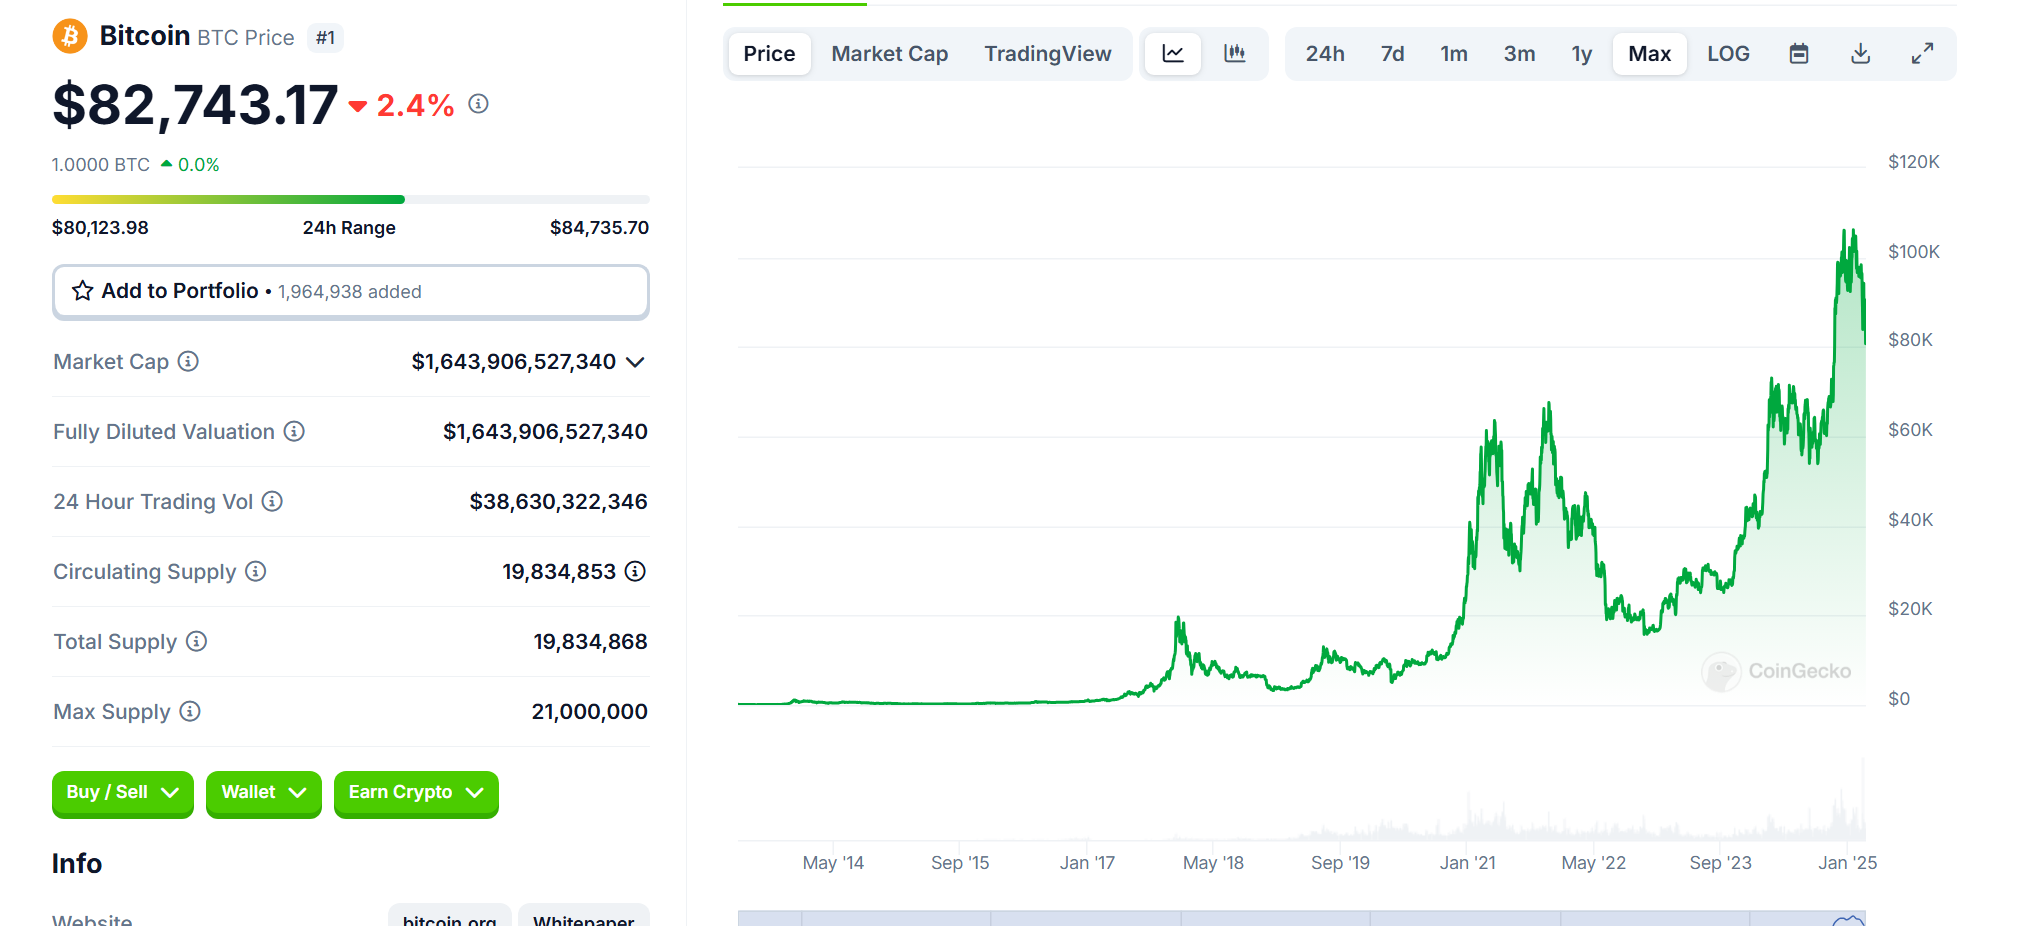
Chart Analysis & Key Insights
Looking at the Bitcoin chart, we can observe:
- Strong Uptrend: Bitcoin recently made new all-time highs above $100K before experiencing a pullback to around $82K.
- Sharp Corrections: After reaching record highs, BTC is undergoing profit-taking and market correction, which is a normal phase in a strong bull cycle.
- Parabolic Growth Pattern: The steep rise followed by a correction is typical in market cycles, where euphoria is met with reality-check corrections.
Trader Psychology Reflected in the Chart
1. Euphoria Phase (Recent All-Time Highs Above $100K)
- Traders who FOMO’d (Fear of Missing Out) into Bitcoin above $100K are now facing losses.
- Many retail investors likely entered the market late, believing BTC would keep rallying, driven by media hype and institutional adoption narratives.
2. Profit-Taking & Fear (Current Correction to $82K)
- Large investors (whales) and institutions may be selling portions of their holdings to lock in profits.
- This selling pressure causes retail traders to panic, accelerating the price drop.
- Those who bought at the peak may now feel fear and doubt, leading to potential further short-term corrections.
3. Reaccumulation Phase (Next 3 Months)
- Smart money (institutional investors & experienced traders) will likely buy Bitcoin at support levels ($75K - $80K range).
- Retail traders who panic-sell will be replaced by long-term holders accumulating more BTC.
- The cycle will likely repeat as BTC builds support and prepares for another move.
Bitcoin Price Prediction for the Next 3 Months (March – June 2025)
Using both technical analysis and trader psychology, here are possible scenarios:
1. Bullish Scenario: BTC Targets $100K+ Again 📈
- If Bitcoin stabilizes above $80K - $82K, we could see a strong bounce back towards $95K - $100K.
- Key Catalysts:
- Institutional buying at support levels.
- Pre-Halving rally expectations (Bitcoin Halving is approaching in 2025).
- Increased mainstream media attention.
2. Bearish Scenario: Bitcoin Drops to $75K - $78K Before Rebounding 📉
- If BTC fails to hold $80K support, a deeper correction could push prices toward $75K - $78K, a strong demand zone.
- Key Catalysts for Further Drop:
- Rising interest rates or unfavorable macroeconomic news.
- A major whale or institution liquidating positions.
- Panic selling from retail traders.
3. Sideways Consolidation: BTC Ranges Between $78K - $90K 📊
- Bitcoin might enter a sideways trading phase between $78K and $90K before making another breakout attempt.
- Historically, after major surges, BTC tends to consolidate before the next leg up.
Final Thoughts: What Should Traders Do?
✅ If you are a long-term investor: Consider accumulating BTC near support levels ($78K - $82K) with a dollar-cost averaging (DCA) strategy.
✅ If you are a short-term trader: Look for breakouts above $90K or buy dips near $78K with tight stop-losses.
❌ Avoid buying out of FOMO: If BTC starts running toward $95K again, wait for a pullback before entering.
Bottom Line: The Bitcoin market is still in a bullish long-term trend, but short-term corrections and consolidations are expected. Keep an eye on institutional movements and macroeconomic factors before making major decisions. 🚀
What do you think? Will you go with ChatGPT's prediction? Let us know!