
Why You Keep Misreading Crypto Charts (And How Psychology Fixes It)
In the world of cryptocurrency trading, mastering chart reading is like learning a new language. But the mistake most traders make is treating charts as purely logical tools. In reality, they reflect human behavior, fear, greed, and decision-making in real time. The better you understand your own psychology and that of the crowd, the more powerful your chart reading becomes.

This article breaks down how to read crypto trading charts more effectively using psychological principles, so you can spot real opportunities—and avoid the emotional traps that wipe out most traders.
1. Why Psychology Matters in Chart Reading
Crypto charts are not just price movements. Every candlestick, volume bar, and pattern you see is a mirror of human emotion. Fear, greed, hesitation, and euphoria are embedded in every market move.
Understanding the chart means understanding the crowd's emotion—and your own.
- A sudden breakout? Likely driven by FOMO (fear of missing out).
- A steep dump? Panic selling from retail traders.
- A sideways move? Indecision or emotional exhaustion.
Bottom line: You can’t read charts well if you don’t read the emotion behind the price action.
2. Know the 3 Psychological Phases in Every Chart Pattern
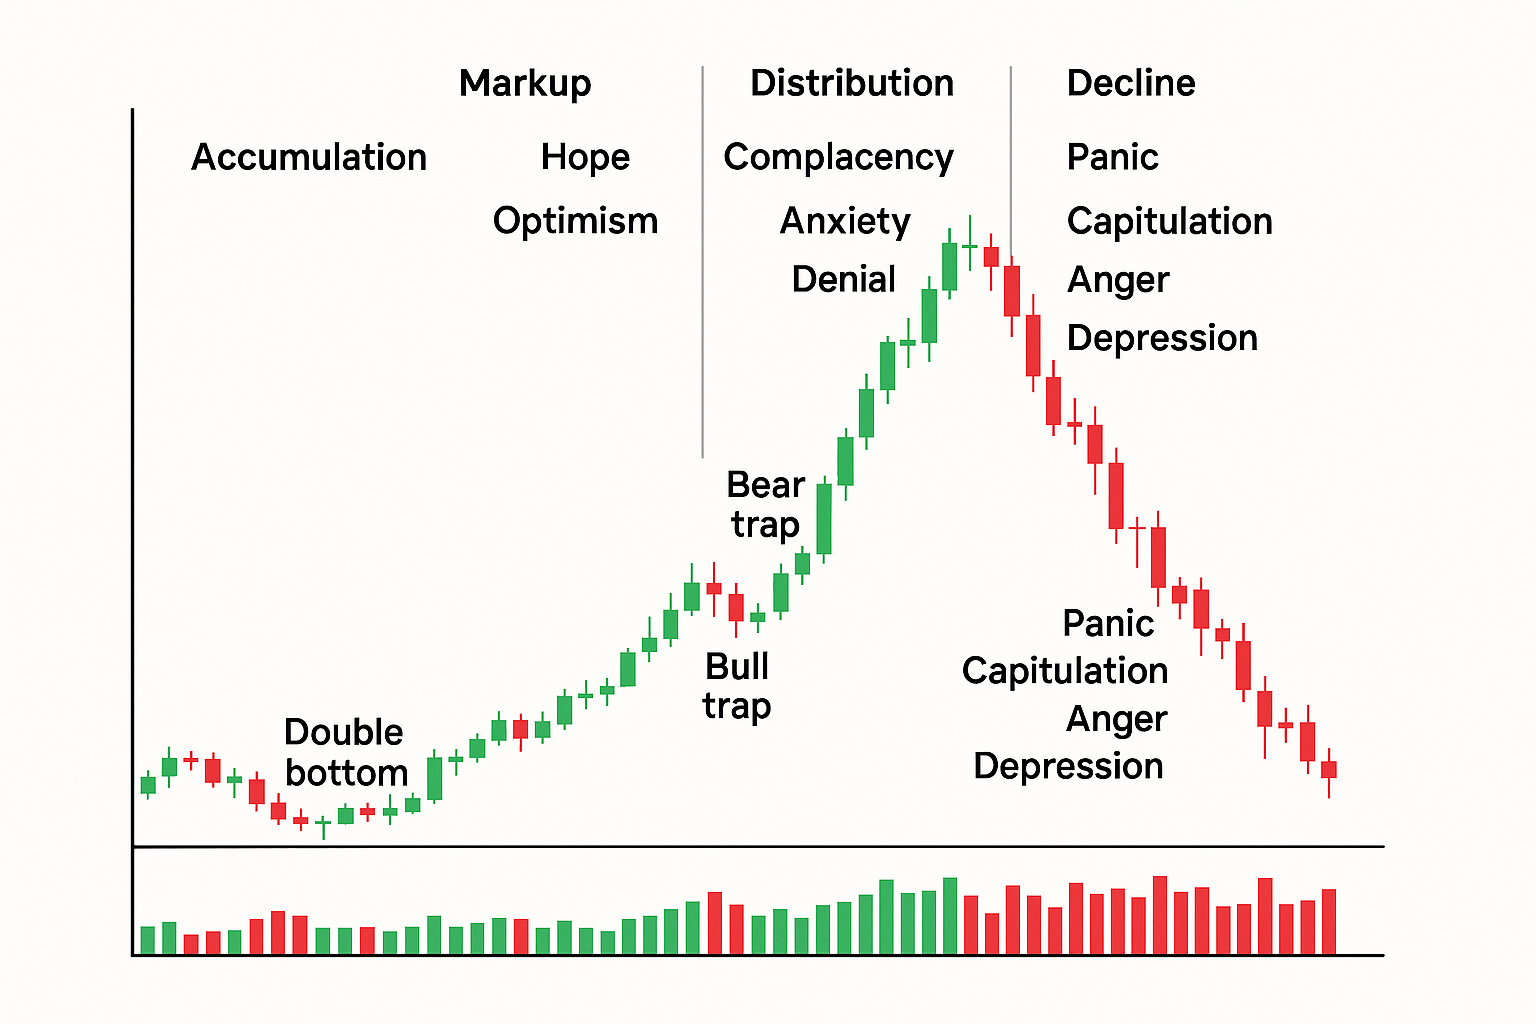
Most crypto price movements go through 3 predictable emotional phases:
i. Accumulation Phase – “Disbelief”
- Price is low, moving sideways.
- Public interest is dead.
- Smart money starts buying quietly.
💡 Psychological Insight: This is when YOU feel bored, skeptical, and afraid to buy. That’s exactly why it's often the best time.
ii. Markup Phase – “Euphoria”
- Price starts climbing.
- Retail traders rush in.
- Social media hype explodes.
💡 Psychological Trap: You feel confident here. Everyone is winning. But you're often buying late.
iii. Distribution / Decline Phase – “Fear & Denial”
- Price peaks and starts falling.
- People hold, hoping it rebounds.
- Eventually, panic selling begins.
💡 Psychological Warning: The pain of being wrong makes many freeze. They don’t want to sell at a loss, so they hold—until it’s too late.
Once you learn to recognize these phases on a chart and in your own mind, you’ll start avoiding bad entries and exits.
3. Candlesticks: Reading Emotion in One Glance
Each candlestick tells a mini-story of trader psychology.
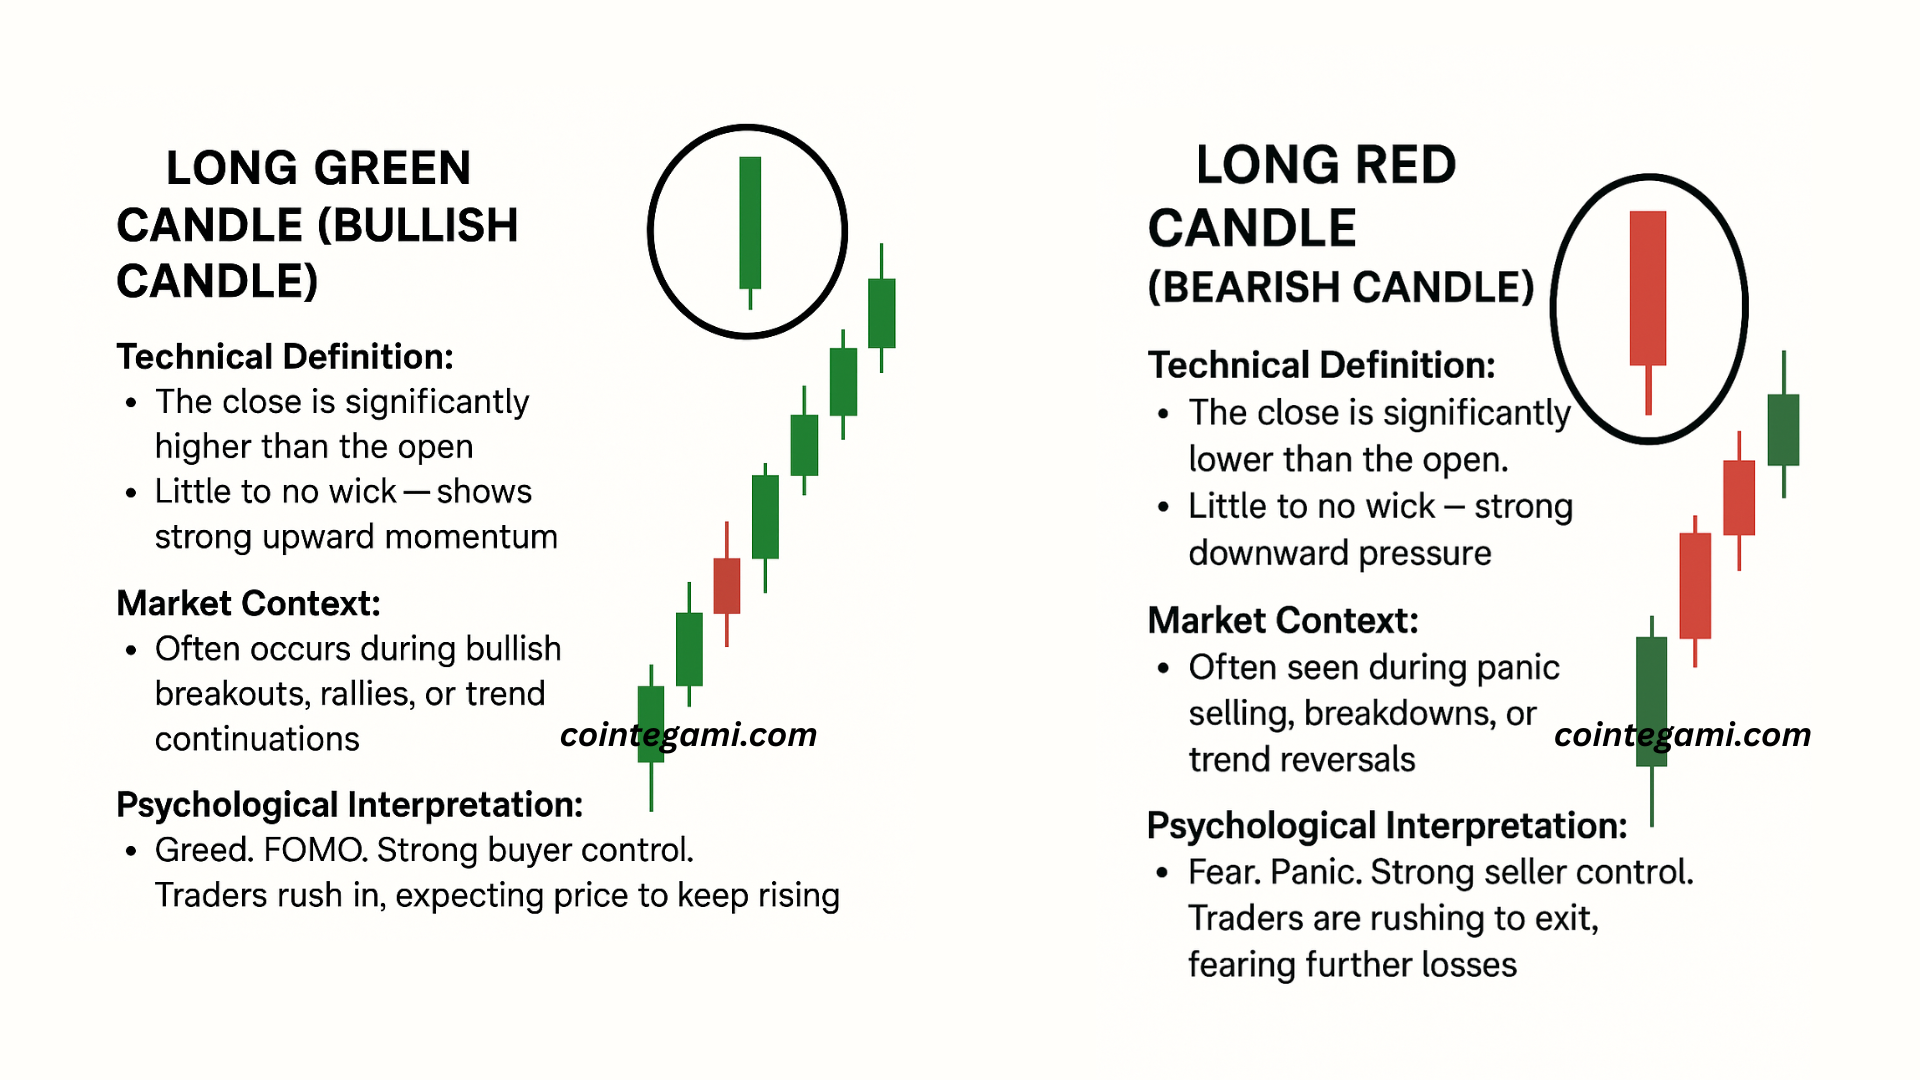
| Candlestick Type | Emotion Behind It |
|---|---|
| Long Green Candle | Greed, FOMO buying |
| Long Red Candle | Panic, fear selling |
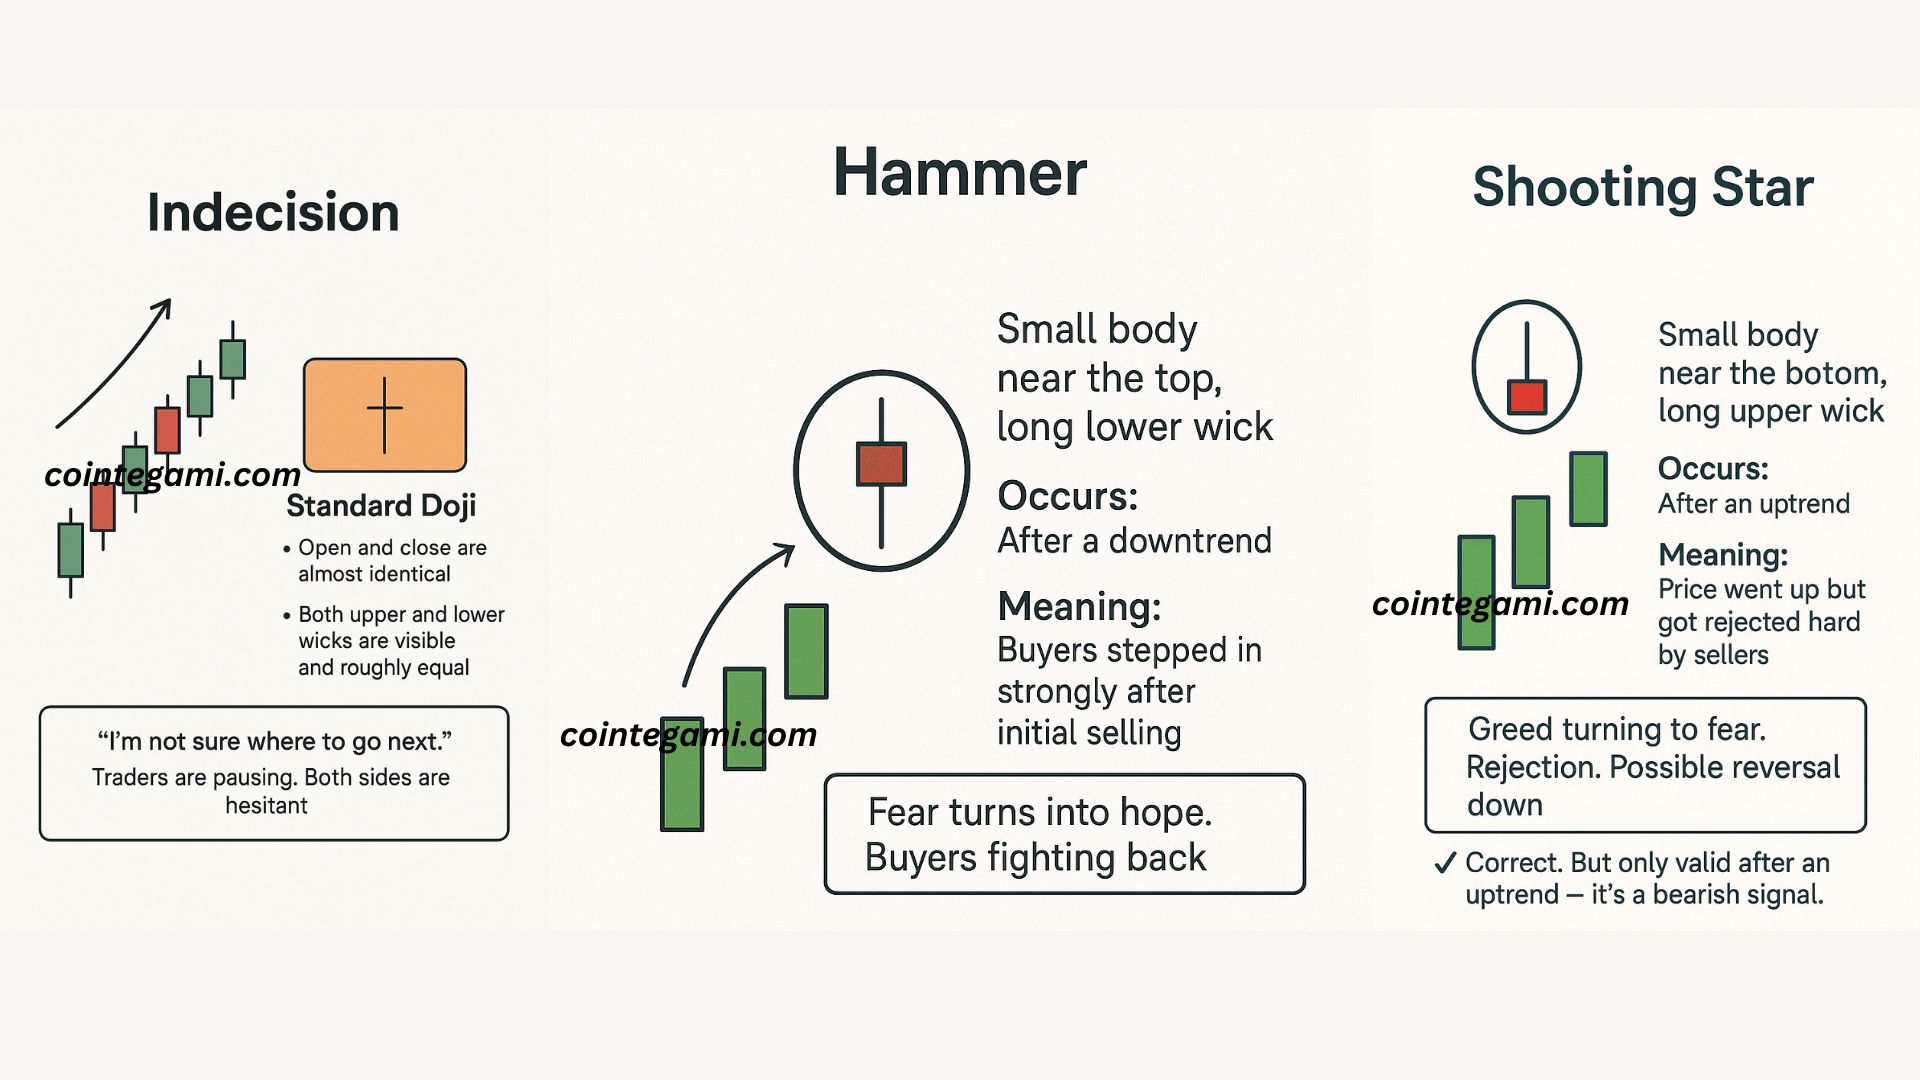
| Doji (small body) | Indecision, hesitation |
| Hammer | Buyers fighting back after fear |
| Shooting Star | Rejection, start of fear |
When you look at a candlestick, don’t just ask what happened. Ask:
“What were traders feeling during this candle?”
This rewires your brain to see the story behind the move—not just the data.
4. Volume: The Voice of the Crowd
Volume confirms whether the price move is believable. A breakout on high volume shows strong conviction. A breakout on low volume? Might be a fakeout.
Use volume to answer:
- Is the crowd supporting this move?
- Is smart money entering—or exiting?
Psychological filter:
- High volume + Green candle = Strong belief
- High volume + Red candle = Fear-driven exit
- Low volume sideways = Emotional fatigue or uncertainty
Volume tells you how emotional the crowd really is. Use it to verify patterns before you act.
5. Chart Patterns Are Just Emotions on Repeat
Patterns like head and shoulders, triangles, double tops, and flags are just recurring emotional cycles.
Example:
- Head and Shoulders: Confidence, euphoria, hesitation, doubt, fear.
- Bull Flag: Excitement → rest → another surge of energy.
When you see a pattern forming, try to name the emotion behind it.
This improves your anticipation, not just recognition.
6. Indicators Are Not Signals – They Are Psychological Filters
Tools like RSI, MACD, Bollinger Bands don’t predict the future. They show when emotions have reached extremes.
- RSI > 70 → Overbought. Crowd is overly optimistic. Caution.
- RSI < 30 → Oversold. Crowd is overly fearful. Opportunity?
Instead of asking “Should I buy because RSI is low?” ask:
“Is this a trap of fear I can benefit from—or a sign of real weakness?”
Learn to filter what’s emotional noise versus genuine signals.
7. The Psychology of Fakeouts and Traps
A common beginner mistake is getting caught in fake breakouts or bull traps.
Why it happens:
- Chart breaks resistance.
- Crowd jumps in (FOMO).
- Whales sell into strength.
- Price dumps. You panic and sell at a loss.
The market punishes emotional behavior. When you see a breakout, ask:
- Is there strong volume?
- Is the candle closing above resistance?
- Is it too obvious to be real?
If it feels too easy, it probably is.
8. Your Own Mind is the Hardest Chart to Read
The biggest barrier to reading charts well is your own bias.
- Confirmation bias: You see what you want to see.
- Recency bias: You think the last trend will continue.
- Overconfidence: You overtrade after a few wins.
🧠 Mental Rule: Every time you open a chart, do a “self-check-in”:
- What am I hoping to see?
- What fear or greed is clouding my view?
- Am I acting based on emotion or evidence?
A chart reader who can observe their own psychology will outperform someone with 10 years of “technical” experience but no emotional control.
9. How to Train Chart Reading Psychology
Just like a bodybuilder trains muscles, you must train emotional detachment when reading charts.
Daily practice:
- Choose 1 chart per day.
- Read the emotion behind the moves.
- Label phases: fear, greed, hesitation, disbelief.
- Predict what emotion comes next.
- Watch what actually happens.
This trains your pattern recognition and emotional intuition.
10. Final Thought: Learn to Feel the Chart Without Being Ruled by It
Great traders don’t just “see” the chart. They feel the rhythm of the market—but they don’t let those feelings control them.
Reading crypto charts is part logic, part art, and deeply emotional.
If you combine technical skill with self-awareness, you gain something rare:
The ability to read what others can’t see—because they’re too emotionally involved.